
Is now a good time to start understanding the evidence for climate change, or should you wait until the science is “more settled”? Short answer: the waiting is over. 2026 is the first moment when an ordinary person can trace the evidence end to end using open data — thermometers, ice cores, satellites, and oceans all telling the same story. This guide walks you through that evidence plainly: no jargon walls, no politics, just the measurements and what they mean, plus how to verify the claims yourself tonight.
The Thermometer Record: The Simplest Evidence of All
The most straightforward evidence for climate change is embarrassingly simple: thermometers. Land stations, ocean buoys, and ship measurements have recorded temperatures since the late 1800s, and independent teams at NASA, NOAA, the UK Met Office, and Berkeley Earth have each processed these records separately — correcting for station moves, instrument changes, and the urban heat island effect. All four arrive at the same answer: the planet has warmed roughly 1.2°C (about 2.2°F) since the pre-industrial era.
Think about what that independence means. Four teams, different methods, same warming trend. That is not a model projection — it is a measurement, and it is why NASA’s climate evidence page leads with surface temperature as the headline fact. According to the EU’s Copernicus Climate Change Service, 2024 was the warmest year in the instrumental record, and the streak of record-warm years in the 2020s has no precedent. (And remember: a cold snap is weather — days, one region. Warming refers to the global average over decades, and local cold events are fully consistent with a rising average.)
Reading the Deep Past: Ice Cores, Tree Rings, and Sediments
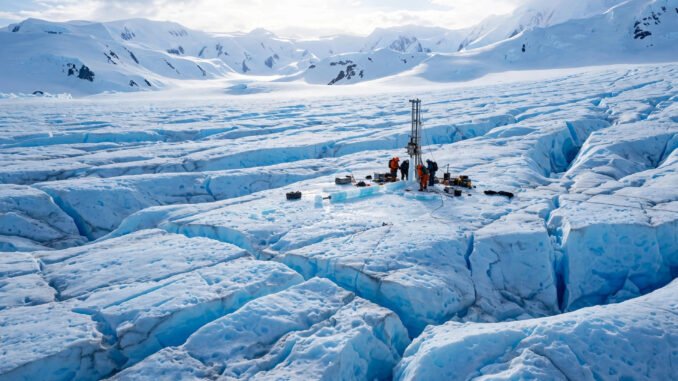
Thermometers only reach back about 170 years. To understand whether today’s warming is unusual, scientists needed thermometers that were running before thermometers existed — and nature provided them. Ice cores drilled in Antarctica and Greenland trap tiny bubbles of ancient air, layer by layer, like pages in a diary going back 800,000 years. Tree rings, lake sediments, and coral growth bands add regional detail.
The verdict from this paleoclimate archive is unambiguous: today’s atmospheric CO2 concentration is higher than at any point in those 800,000 years, and the current rate of warming is roughly ten times faster than the average rate of warming coming out of the last ice age. This is why past natural warm periods do not explain the present one — scientists have the records of those periods, and the speed and cause of today’s change look nothing like them.
None of this requires trusting one lab. The ice-core record has been built by American, European, Russian, Japanese, and Chinese teams across decades, and they all converge. For readers who want to see the actual curves, NOAA’s climate data portal hosts the public datasets with plain-English explainers.
The Fingerprint Evidence: Proof That Humans Caused It
Warming is one thing; proving humans caused it is another, and this is where the evidence gets genuinely elegant. Greenhouse physics predicts specific “fingerprints” that natural warming would not produce — and every one of them has been found.
Fingerprint 1: The upper atmosphere is cooling
Physics predicts that if warming comes from more greenhouse gases trapping heat low in the atmosphere, the stratosphere above should actually cool. Satellites and weather balloons confirm it: the troposphere is warming while the stratosphere cools. Increased solar output would warm both layers, so this pattern points squarely at greenhouse gases.
Fingerprint 2: Nights warming faster than days, winters faster than summers
Greenhouse warming works by trapping outgoing heat — it has the strongest effect when the sun isn’t shining. Sure enough, nighttime lows and winter temperatures have risen faster than daytime highs and summer temperatures. A brighter sun would warm days fastest instead.
Fingerprint 3: The isotopic signature of fossil fuels
Carbon from fossil fuels has a distinct ratio of carbon isotopes — it is “lighter” than carbon from volcanoes or ocean outgassing. Measurements at monitoring stations worldwide show the atmosphere’s carbon getting lighter in exact proportion to fossil fuel burning. This is chemistry, not modeling: the rising CO2 carries the fingerprint of burned coal, oil, and gas.
Together, these fingerprints are why the IPCC’s Sixth Assessment Report concluded it is “unequivocal that human influence has warmed the atmosphere, ocean and land.” That word — unequivocal — is the strongest language the IPCC has ever used, and it rests on the IPCC AR6 physical science assessment, the most reviewed scientific document in history.
Why 2026 Is the Best Year Ever to Start Learning
So should you start now or wait? Start now — the timing is genuinely in your favor. Attribution science — determining whether a specific heatwave or flood was worsened by climate change — has moved from academic papers to rapid public tools like World Weather Attribution, which publishes analyses within days of major disasters. And satellite coverage is unprecedented: missions like NASA’s PACE (launched 2024) monitor oceans, aerosols, and clouds in detail previous generations couldn’t imagine, with public dashboards showing sea-level rise, ice loss, and ocean heat in near-real time.
How to Learn the Evidence Without Drowning in It
The biggest risk for a beginner is not misinformation — it is drowning in too much information and giving up. Use this three-step filter.
Step 1: Start with the measurements, not the projections. Models of 2100 are interesting, but the evidence case rests on what has already been measured: thermometers, ice cores, sea level gauges (up over 20 centimeters since 1900), and satellite ice mapping. Learn these first and everything else clicks into place.
Step 2: Check primary sources, not commentary. When someone claims “scientists were predicting an ice age in the 1970s,” go to the primary literature instead of the meme. The actual 1970s papers were mixed, with warming papers outnumbering cooling ones — and Skeptical Science’s documented rebuttal traces the myth to its source. This habit — primary source first — will serve you for life.
Step 3: Follow one dataset for a month. Pick the Mauna Loa CO2 curve (the Keeling Curve, running since 1958), the global temperature anomaly, or Arctic sea ice extent. Watching one measurement move week by week turns abstract knowledge into felt understanding. The Keeling Curve’s relentless sawtooth climb — seasonal wiggles riding an unstoppable upward slope — is the single most persuasive graph in climate science.
Connecting the Evidence to Your Own Life
Once you can read the data, everyday decisions get easier — from why insurers reprice flood zones to which home upgrades pay off, like choosing energy-efficient upgrades for an older home or winterizing your home before cold weather hits. Informed owner beats activist or skeptic.
Conclusion: Don’t Wait — the Evidence Is Ready When You Are
The case for understanding climate evidence has never been stronger or more accessible. Four independent temperature records, 800,000 years of ice-core air, three physical fingerprints pointing at fossil fuels, and a generation of public tools that let you verify it all yourself. The science settled into its current form years ago; what is new in 2026 is that a beginner can walk the whole chain of reasoning in an evening. Start with the thermometers, check the fingerprints, follow one dataset for a month — and you will know more about how we know than most of the people arguing about it online. That is time well spent, and there is no better year than this one to begin.
Frequently Asked Questions
Is the scientific consensus on climate change really 97%?
The famous figure comes from studies of published, peer-reviewed climate papers (notably Cook et al., 2013), which found that 97% of papers taking a position endorsed human-caused warming. What matters more than the number is why: thousands of independent measurements converging, not a vote.
What is the single strongest piece of evidence for climate change?
There isn’t one — the strength is the convergence. But if forced to pick, the isotopic fingerprint of fossil-fuel carbon in the rising CO2 is extraordinarily hard to explain any other way: a direct chemical signature, not a statistical inference.
Haven’t climates always changed naturally?
Yes, and paleoclimatology studies those changes in detail. The difference is rate and cause: current warming is about ten times faster than post-ice-age warming, and it carries the isotopic and atmospheric fingerprints of fossil fuels that natural warmings lack. “It changed before” is answered by the records of those past changes.
Can I really check the data myself?
Absolutely. NOAA, NASA, and the Hadley Centre publish their raw and processed datasets freely. The Keeling Curve data from Mauna Loa is updated continuously and downloadable. You need no special credentials — just curiosity and a spreadsheet program.
How long does it take to understand the basics?
Most committed beginners grasp the core evidence — temperature record, CO2 curve, fingerprints — in a few focused evenings, roughly 6 to 10 hours. Following one dataset for a month afterward turns that knowledge into intuition.
Leave a Reply